Introduction
In the Water supply industry, managing pressure effectively is crucial for reducing water loss and optimising system performance. Horowhenua District Council’s advanced pressure management system, which utilises i2O pressure management technology, along with Infrastructure Data offers a comprehensive solution to these challenges.
Understanding Pressure Management Zones
HDC’s Levin water supply network now operates within 4 Pressure Management Zones (PMZs), which are essential for monitoring and controlling water flow. The i2O pressure management system integrates seamlessly with Infrastructure Data, allowing us to both control and monitor pressure reducing valves (PRVs), ensuring optimal performance across the network.
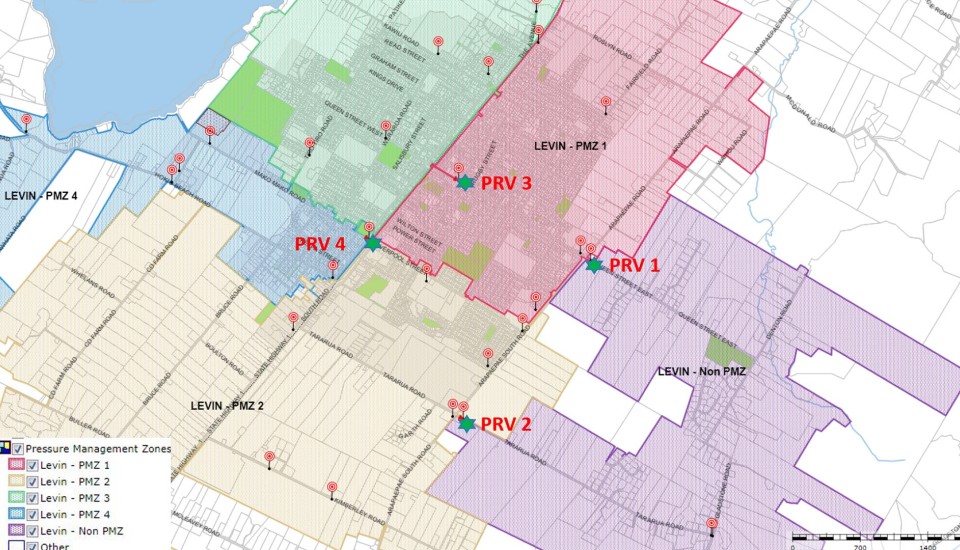
The above map shows the PMZs along with the PRV and Data Logger locations.
The Importance of Water Balance
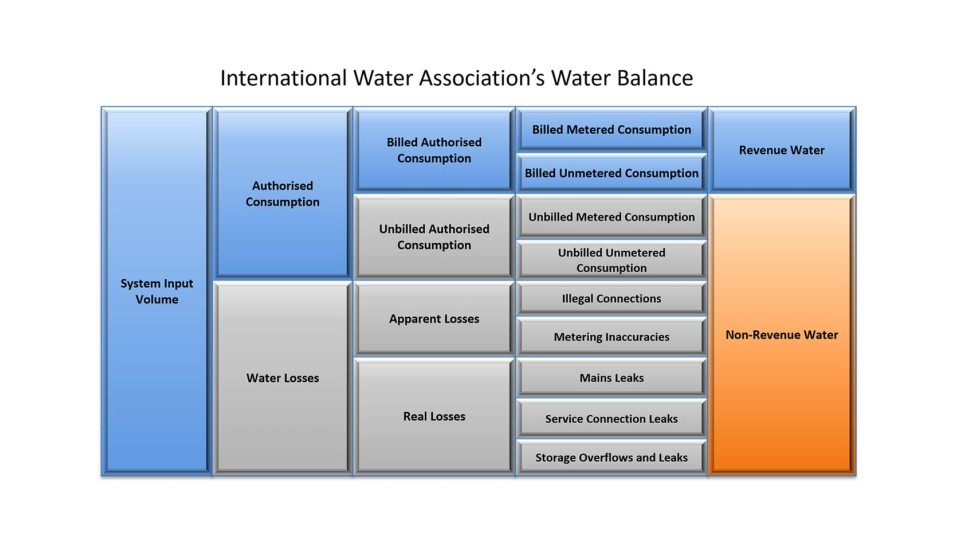
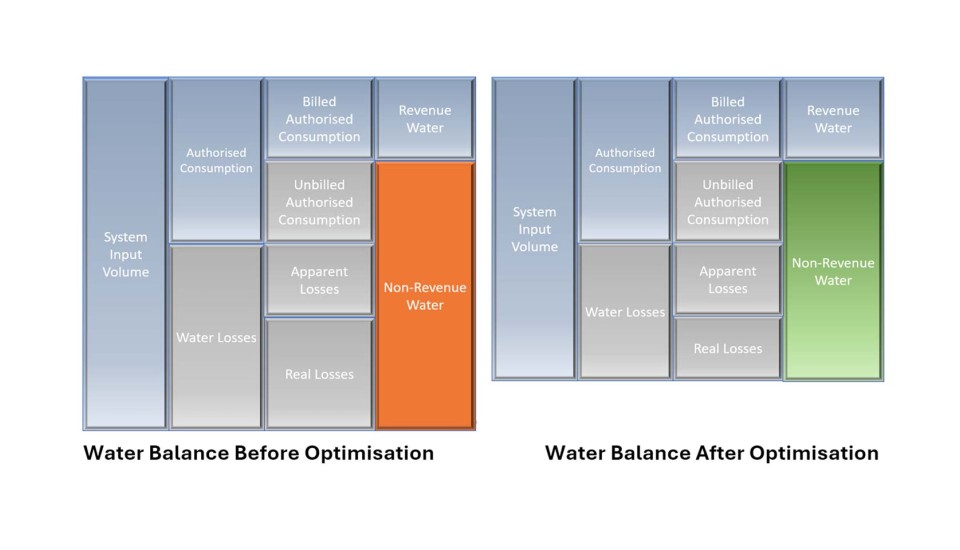
The International Water Association’s water balance framework helps us understand where water goes and how it is consumed. By breaking down system input volumes, we can monitor authorised consumption and water losses using SCADA and flow meters. This data is essential to identifying and addressing physical water losses from pressurised networks.
Challenges Before Universal Water Metering
Without universal water metering, HDC lacked data to measure Authorised Consumption accurately. Like many other water suppliers, we had to rely on night flow analysis to determine Water Losses. This often led to unquantified real water losses, as unmetered consumption appeared as service connection leaks.
Four-Pronged Approach to Real Water Loss Management
- Active Leakage Control: Utilising bulk flow meters across the network, we monitor night flows and use ID dashboards to track data from all zones. This information is exported from the i2O data loggers and integrated into the ID system for analysis.
- Speed and Quality of Repairs: Continuous night flow monitoring help us identify problem areas so that quick and efficient repairs can be done, essential for reducing water losses.
- Good asset management planning: Selecting appropriate materials, and timely asset replacement are critical components. Monitoring Real Losses from Mains Leaks allows us to judge which pipes need to be replaced more effectively than relying simply on the age of the asset.
- Pressure Management=:This is the most cost-effective method for reducing water losses. By adjusting excess pressure without affecting customer service levels, we significantly improve water loss performance. In Levin for example water pressure can reach 900Kpa whereas the acceptable level of service was just 250Kpa, so there was a lot of room to optimise pressure.
Doing this reduces leakage rates and can extend life not just of pipes and infrastructure but also customer equipment such as hot water cylinders and even tap washers.
Advanced Pressure Optimisation
The pressure management system includes flow meters, PRVs, and data loggers to measure system pressures. The PRVs are controlled by i2O’s automatic pilot valves and control loggers, stabilising network performance and reducing excess pressure during low demand periods. This also means we can reduce overall water production and delay capital investment and costly upgrades of water treatment plants.
ID Installation Notes
We use ID for a few different functions including providing detailed installation notes for the PRVs and relevant equipment in the system.
ID Pressure Monitoring
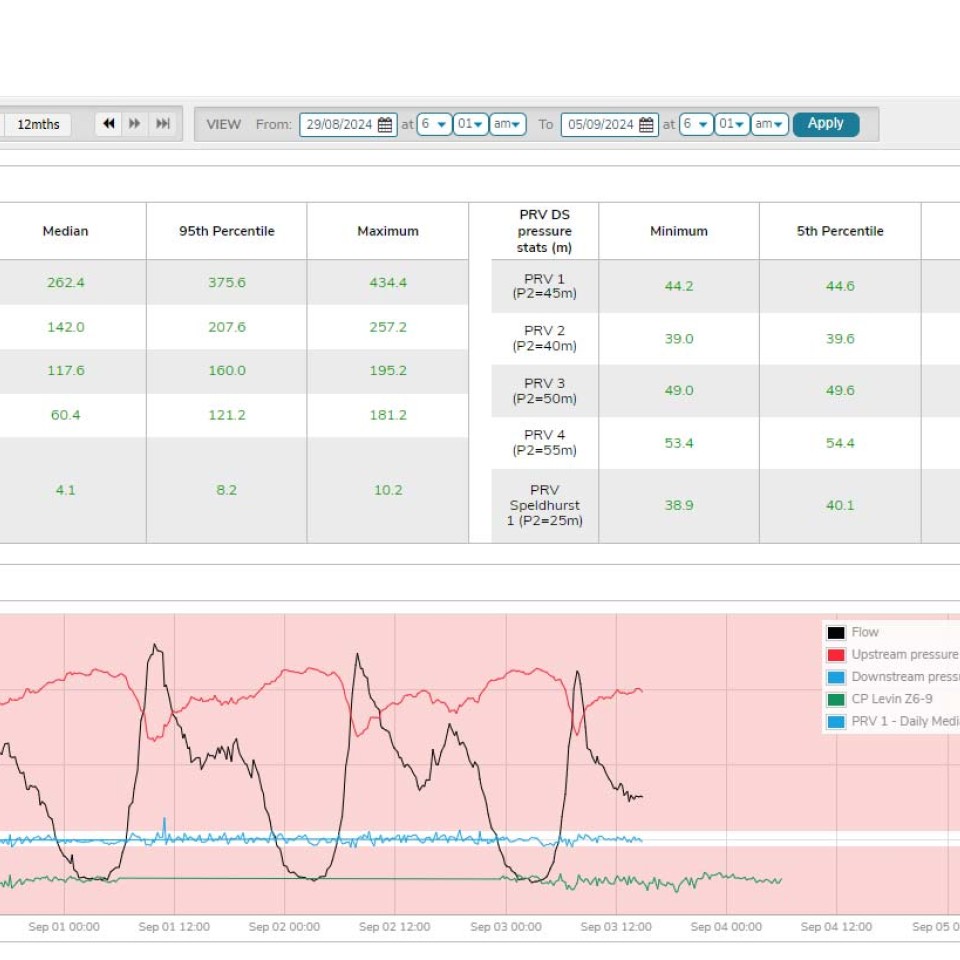
ID is used for monitoring the network pressure data of upstream, downstream and control space pressures at PRVs and critical point pressure data imported from i2O data loggers. We use soft sensors in ID to graph daily median downstream pressure on dashboards, setting critical low and high limits for visual monitoring.
The ID dashboard provides a clear visual representation, most importantly allowing you to see whether downstream pressure remains within the desired range, both with the graph and a dedicated box plot. Any deviations outside of certain set points also trigger alarms, prompting the operations team to investigate and address issues promptly. This proactive approach helps maintain optimal performance and prevents failures.
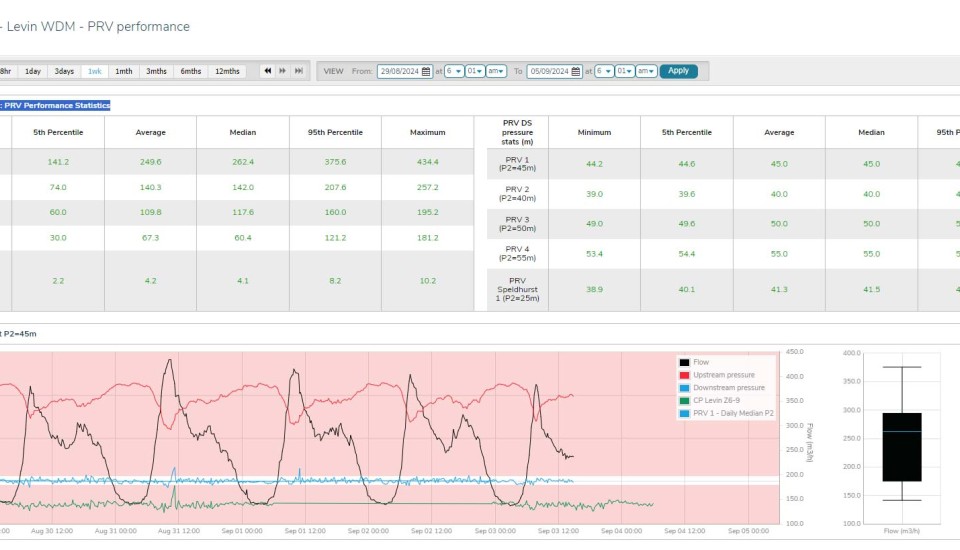
Here we see the PRV performance dashboard, showing the pressure trends and a box plot on the right that quickly shows if a PRV is drifting out of its acceptable performance range.
ID Flow Meter Battery Monitoring
HDC have implemented soft sensors to the monitor battery-operated flow meters. These sensors count the days with zero recorded flow and trigger alarms if no flow is detected for a day as this shows that the battery has likely run out. This system ensures timely battery replacements and reduces the need for manual checks, allowing operators to focus on more critical tasks.
Benefits of Pressure Management
Implementing advanced pressure management in areas like Levin, where water pressure and leakage rates could both be excessively high, has shown remarkable results. By reducing pressure, we not only decrease leakage but also extend the lifespan of infrastructure and reduce maintenance needs. Consumers benefit from fewer bursts and less frequent replacements of tap washers and hot water cylinders, all without any noticeable drop in service.
Conclusion
HDC’s advanced pressure management system, powered by i2O technology and Infrastructure Data, has been a great tool in reducing real water losses and optimising HDC’s water treatment systems. By leveraging data and technology, we can make informed decisions, improve system performance, and ensure sustainable water management for the future.


