![]()
Data Integrity
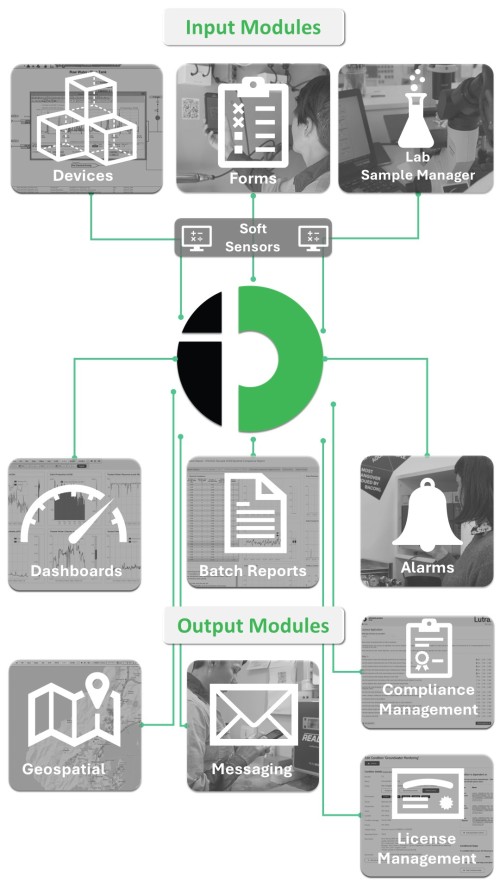
ID captures data from your laboratories, SCADA, IoT devices and field teams in a single secure location.
![]()
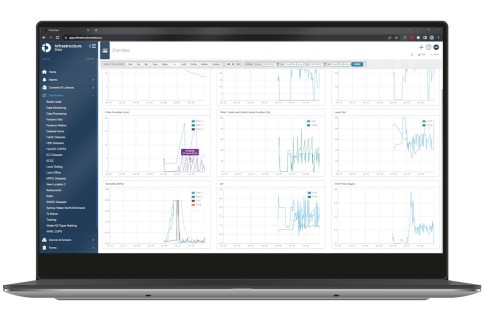
Operational Overview
ID gives you a utility-wide view of how your treatment operations are performing against KPIs & regulatory requirements.
![]()
Save Time
Powerful visualisations, automated scheduling, task tracking and compliance report generation, all save you time.
![]()
Data Cleansing
With powerful data cleansing tools, smart alarms and notifications, you will never miss an event again.
Decision making is made easy, with real time operational insights accessible to you and your team, anywhere, at anytime.
How our clients use ID to improve their operations:

City Council - Paper To Digital
This city council previously utilised a paper-based data collection system with manual entry of the data into a spreadsheet and other systems for preparing reports and invoicing. Experiencing issues such as misplaced paper-based information, The council knew it was time to do make a change to the way they were working. By implementing Infrastructure Data, all operations staff were able to collect onsite data via their mobile phone, providing immediate access to important information and without the issues of losing paper records and incorrect data from hard to read handwriting. Automated reports were generated from the collected data, saving time, and reducing human error. Streamline your data collection and reporting with ID.

Local Council- Load Based Licensing
Councils across New South Wales need to comply with their Environmental Protection Licences (EPL), which often include load limits and associated fees for pollutants discharged to the environment. One council wanted a solution to make managing these licence requirements quicker and easier for everyone involved, such as collating the required data from multiple sources into a report, which could be used to generate their annual return. Infrastructure Data was utilised to manage a number of Council’s EPL requirements including preparing required information for load-based licence reporting as well as automating the generation of website reports with pollution monitoring data. Dashboards displaying pollutant loads were generated.
Regional Council- Digital Transformation
Experiencing issues with collection of information in a timely, visually attractive and accurate manner, this regional council decided to look for a solution. After considering a number of options, the council decided that Infrastructure Data could provide the functionality they required, including ID’s ability to automatically collate information from various sources such as operator logs, inspections and water/effluent quality data, share this same information accurately with everyone in the business, and automatically generate reports and dashboards. There was no longer a need for manually transferring data into various spreadsheets, the chance for manual errors was reduced and the council also appreciated having a single source of truth for their operational information.

More than just compliance reporting:
![]()
Chemical Tracking
Infrastructure Data is able to help track chemical tracking and even generate alarms when supplies are low.
![]()
Trade Wastes
Fully manage trade waste applications, licenses and even usage calculations. All handled within ID.
![]()
Drinking Water Guidelines
Make sure you are meeting the guidelines using automatic batch reports and by monitoring custom dashboards.
![]()
EPA Licensing
ID can help manage your EPA licensing activities, from applications through to usage calculations.
Advanced Process Modules, beyond compliance:
The below videos show how Advanced Process Modules (APMs) can help improve your plant performance:
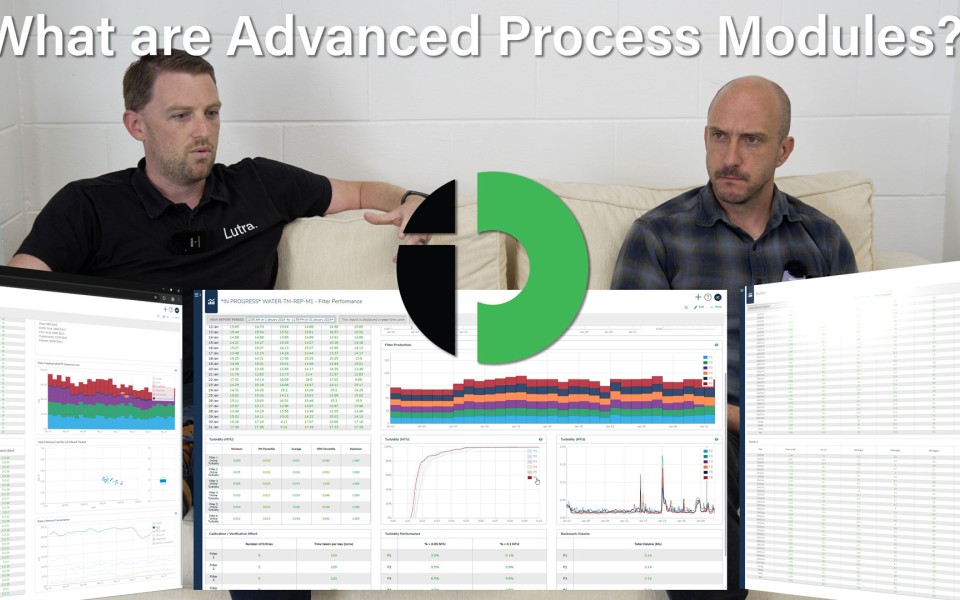
What are Advanced Process Modules?
ID can do far more that just compliance reporting, with Advanced Process Modules (APMs) you can get in depth information on how your processes are performing, which can be used to drive positive outcomes, including saving chemicals, time, money and extending equipment life.
In this Lutra TV Episode we talk about the ways the different APMs can be used for both water and wastewater treatment, from Activated Sludge to Filter Performance, watch the full video for a more in depth look at what they have to offer.

Biofilm Processes APM
With technologies like MABR and MBBR popping up more regularly, biofilm is becoming a more common technology for upgrades or biological intensification.
We produced a report, which can take lab data, form data or SCADA data such as total flow, pollutant concentrations, etc. and calculate surface area loading rates and surface area removal rates.
With temperature data, we can do temperature correction to normalize to a reference temperature, where separately we can account for substrate limitations in the removal rates.
If that's more complicated than you need, we can just look at removal efficiencies for pollutants like soluble BOD, soluble COD, ammonia or nitrate.
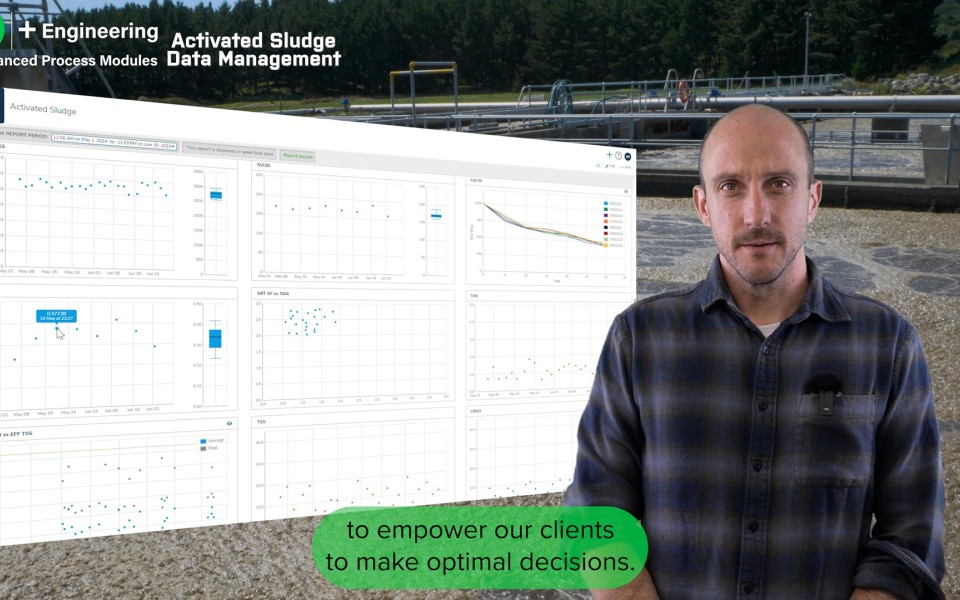
Activated Sludge APM
Our activated sludge module is an analytical batch report which will give good process insight while setting the goal posts for activated sludge data collection.
We can take lab data, form data and SCADA data to consistently and correctly calculate parameters such as SVI, SRT, F to M, SRT safety factor, secondary clarifier hydraulic and solids loading rates.
We then average them across the time period shown here as a week to provide analytical insights. The idea being that we embed our consulting knowledge into ID to empower our clients to make optimal decisions.
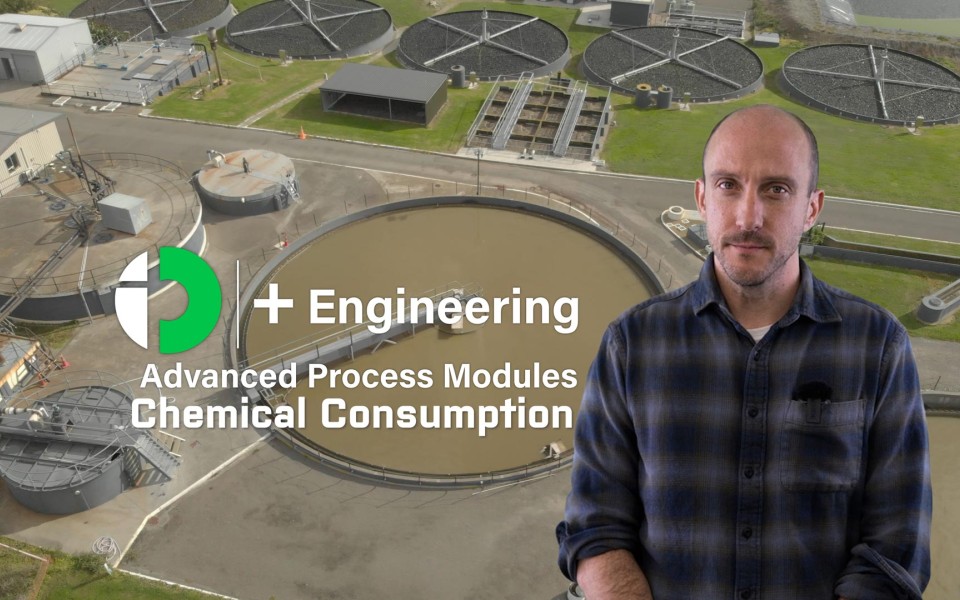
Chemical Consumption APM
With nutrient removal to low concentrations becoming more common, wastewater treatment plants are having to either build new plants, retrofit chemical dosing, or dose more chemical to achieve effluent nitrogen and phosphorus limits.
So Lutra developed this batch report that can take form data or SCADA data such as flow meter, totalisers, tank levels, etc. to consistently and accurately calculate daily, weekly, monthly or annual chemical consumption across a wastewater treatment plant such as alum, acetic acid or caustic soda.
We can then apply unit cost to calculate overall opex and cost per cubic meter, to help you understand whether you are dosing chemical in a cost-effective way and catch any drifts in efficiency.

Some of our clients.
